How to Read YouTube Analytics: A Creator's Guide to Data-Driven Decisions
YouTube analytics can be overwhelming. This step-by-step guide teaches you how to read and interpret your data to make better content decisions.
Quick Answer
If you want better results from how to read YouTube analytics, focus first on packaging quality, then retention quality, and finally consistency of execution. Most channels grow when they improve these three levers in sequence, not in isolation.
Key Takeaways
- Start each video with one clear intent tied to "how to read YouTube analytics" and keep your packaging aligned with that intent.
- Track click-through rate, average view duration, and watch time together. Improving only one metric is rarely enough.
- Use a repeatable weekly workflow: audit, update, test, and document outcomes.
- Link related videos and blog posts so each new upload strengthens your full content ecosystem.
On this page
Introduction: Making Sense of the Data
YouTube Analytics can feel overwhelming. With dozens of metrics, graphs, and reports, it's easy to get lost. But learning to read and interpret your analytics is one of the most valuable skills you can develop as a creator.
This guide will teach you how to read YouTube Analytics like a pro, interpret what the data means, and use those insights to make better content decisions that drive growth.
Getting Started: Navigating YouTube Analytics
YouTube Analytics is divided into several key sections:
- Overview: High-level metrics and trends
- Content: Individual video performance
- Audience: Who watches your content
- Research: What your audience searches for
- Revenue: Monetization metrics (if monetized)
Start with the Overview tab to get a sense of your channel's overall health, then dive into specific sections based on what you want to understand.
Understanding Key Metrics
Before diving into reports, understand what each metric means:
Views
What it is: Total number of times your videos were watched.
What to look for: Trends over time, not just total numbers. Are views increasing, decreasing, or stable?
Red flag: Declining views over several months indicates a problem.
Watch Time
What it is: Total minutes viewers spent watching your content.
What to look for: This is YouTube's primary ranking signal. Focus on increasing total watch time, not just views.
Red flag: Watch time not growing with views means viewers aren't staying engaged.
Subscribers
What it is: Number of people subscribed to your channel.
What to look for: Growth rate and subscriber engagement. Are subscribers actually watching your new videos?
Red flag: Gaining subscribers but they're not watching suggests content mismatch.
Average View Duration
What it is: How long viewers watch on average.
What to look for: Percentage of video length. 50%+ is good, 60%+ is excellent.
Red flag: Below 30% suggests content isn't engaging.
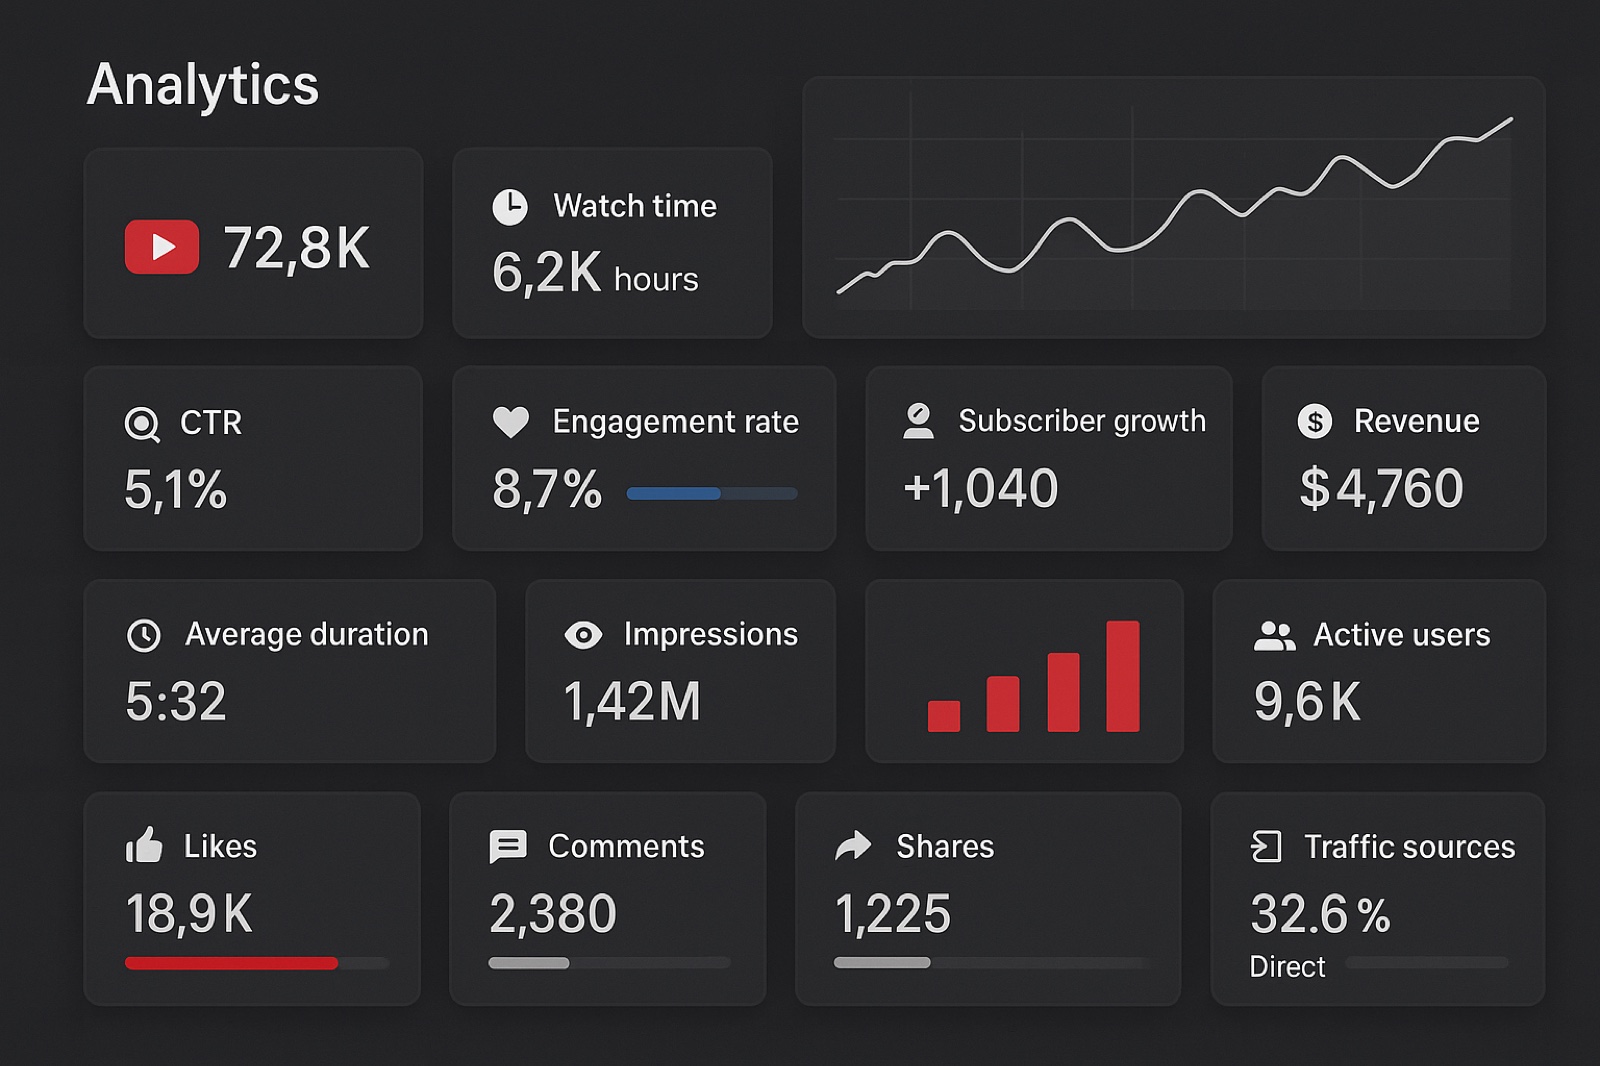
Reading the Overview Dashboard
The Overview tab shows your channel's health at a glance:
Key Metrics to Check Daily
- Views: Are they trending up, down, or stable?
- Watch Time: Is it growing with views?
- Subscribers: Are you gaining or losing subscribers?
- Revenue: If monetized, is RPM stable or improving?
Understanding the Graphs
YouTube shows graphs for different time periods (last 28 days, last 90 days, etc.). Look for:
- Trends: Are metrics going up, down, or staying flat?
- Spikes: What caused sudden increases or decreases?
- Patterns: Do certain days or times perform better?
Analyzing Individual Video Performance
The Content tab shows how each video performs. Here's what to look for:
Top Performing Videos
Identify your best videos and analyze why they succeeded:
- What topics do they cover?
- What format do they use?
- When were they published?
- What titles and thumbnails did they use?
Look for patterns and replicate what works.
Underperforming Videos
Analyze videos that didn't perform well:
- Why did they fail?
- What was different about them?
- What can you learn from the failure?
Use failures as learning opportunities, not just disappointments.
Video Deep Dives
Click into individual videos to see detailed metrics:
- Retention Graph: Shows where viewers drop off
- Traffic Sources: Where views came from
- Demographics: Who watched the video
- Engagement: Likes, comments, shares
Viewera's video deep dive feature provides even more detailed insights, helping you understand exactly why videos perform the way they do.
Understanding Audience Analytics
The Audience tab reveals who watches your content:
Demographics
Understand your audience's age, gender, and location:
- Does your audience match your target?
- Are you reaching the right people?
- Should you adjust your content strategy?
When Your Viewers Are on YouTube
This graph shows when your audience is most active:
- Use this to schedule uploads
- Publish when your audience is online
- Consider time zones if you have international viewers
Other Videos Your Audience Watches
See what else your viewers watch:
- Identify content gaps
- Find collaboration opportunities
- Understand audience interests
Interpreting Traffic Sources
Understanding where views come from helps you optimize:
YouTube Search
Views from search mean your SEO is working. If this is low:
- Improve titles and descriptions
- Target better keywords
- Optimize for search intent
Suggested Videos
Views from suggestions mean YouTube is recommending you. If this is low:
- Improve watch time and retention
- Create content that keeps viewers watching
- Build playlists to increase session time
Browse Features
Views from browse mean you're appearing on YouTube's homepage. This is a sign of strong performance.
External
Views from outside YouTube (social media, websites, etc.). Track which external sources drive the most traffic.
Reading Retention Graphs
Retention graphs show where viewers drop off. This is crucial data:
What to Look For
- Initial Drop: How many viewers leave in the first 15 seconds?
- Steady Decline: Is retention dropping gradually or suddenly?
- Spikes: What causes viewers to re-engage?
- End Retention: How many viewers watch to the end?
How to Fix Problems
- High Initial Drop: Improve your hook, make first 15 seconds more engaging
- Sudden Drops: Identify what happens at that moment and fix it
- Low End Retention: Improve your conclusion, add stronger CTAs
Making Data-Driven Decisions
Analytics are useless if you don't act on them. Here's how to make decisions:
Weekly Review Process
- Check overview metrics (views, watch time, subscribers)
- Identify top and bottom performing videos
- Look for patterns in what works
- Make one change based on insights
Monthly Deep Dive
- Analyze traffic sources and trends
- Review audience demographics and behavior
- Identify content gaps and opportunities
- Adjust content strategy based on data
Quarterly Strategy Review
- Review long-term trends
- Assess if strategy is working
- Set new goals based on data
- Plan content calendar for next quarter
Viewera's insights generation automates this process, providing actionable recommendations based on your analytics data.
Common Analytics Misinterpretations
Avoid these common mistakes:
- Focusing on Total Views: Watch time matters more
- Ignoring Trends: One-time metrics are less valuable than trends
- Comparing to Others: Focus on your own growth, not competitors
- Over-Analyzing: Don't get paralyzed by data. Take action
- Ignoring Context: Consider external factors (seasonality, trends, etc.)
Setting Up Analytics Alerts
Set up alerts for important metrics:
- Subscriber milestones
- Watch time goals
- Revenue targets
- Unusual drops or spikes
Viewera's alerts feature notifies you when important metrics change, so you can respond quickly to opportunities or problems.
Conclusion: Analytics as Your Growth Compass
Learning to read YouTube Analytics is like learning a new language. At first, it's confusing. But with practice, you'll start seeing patterns, understanding what the data means, and making better decisions.
Remember: Analytics are tools, not goals. Use them to understand your audience, optimize your content, and make data-driven decisions. But don't let numbers become an obsession. Great content will always be the foundation of success.
Ready to master YouTube Analytics? Try Viewera and get access to advanced analytics, insights generation, and data-driven recommendations that help you understand your channel and grow faster.
Frequently Asked Questions
What is the fastest way to improve how to read YouTube analytics?
Improve your title-thumbnail promise and the first 30 seconds of the video first. This usually creates the biggest early lift in both CTR and retention.
How often should I review analytics for how to read YouTube analytics?
Review core metrics weekly and run a deeper content-level analysis monthly. This gives enough data to spot patterns without overreacting to noise.
Can I use AI tools without losing content quality?
Yes. Use AI for ideation, structure, and optimization support, but keep the final narrative, examples, and voice aligned to your audience and expertise.
Related Articles
YouTube Analytics Explained: 15 Metrics That Actually Matter for Channel Growth
Stop drowning in data. Learn which YouTube analytics metrics actually matter for growth and how to use them to make data-driven decisions.

YouTube Shorts Analytics: How to Grow Your Shorts Channel in 2025
Shorts require different strategies than long-form content. Learn how to use Shorts analytics to grow your channel and maximize engagement.

The Complete YouTube SEO Guide for 2025: Rank Higher and Get More Views
Learn the latest YouTube SEO techniques that actually work. We analyzed 10,000+ videos to create this comprehensive guide covering titles, descriptions, tags, thumbnails, and analytics.
Ready to Optimize Your YouTube Channel?
Viewera gives you clear analytics, SEO optimization tools, and content insights to help you grow your channel.
Start Free Trial